Business Intelligence is a tool for collecting, storing, and analyzing data within your management software, with the goal of improving your company's performance.
How popular are your products and services among customers?
What type of intervention keeps your technicians most occupied, and with what productivity?
What is the monthly revenue? How much are the expenses?
Can you meet the delivery dates for customer orders?
The answers to these and many other questions can be visualized on graphs tailored to your specific needs, directly in your management software.
From the second year, the fee is reduced by 50%
Reduced fee starting from the second year
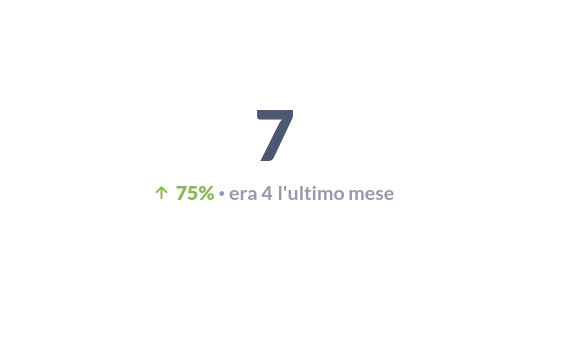
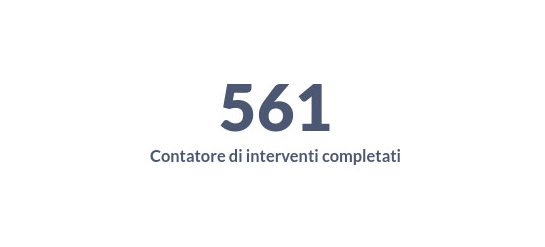
*Counters: unlike graphs, they are boxes that display a simple sum of values such as the total number of products sold, customers acquired in the last year, or assistance provided.
Business intelligence serves to answer the questions that every entrepreneur or manager asks themselves. Questions that are sometimes simple, unlike the answers:
These are just some typical questions, but you may have others specific to your sector or your working method. That’s why we don’t just sell a product but a tailored service, with which you can visualize and analyze this data simply, quickly, and effectively.
BAR GRAPH
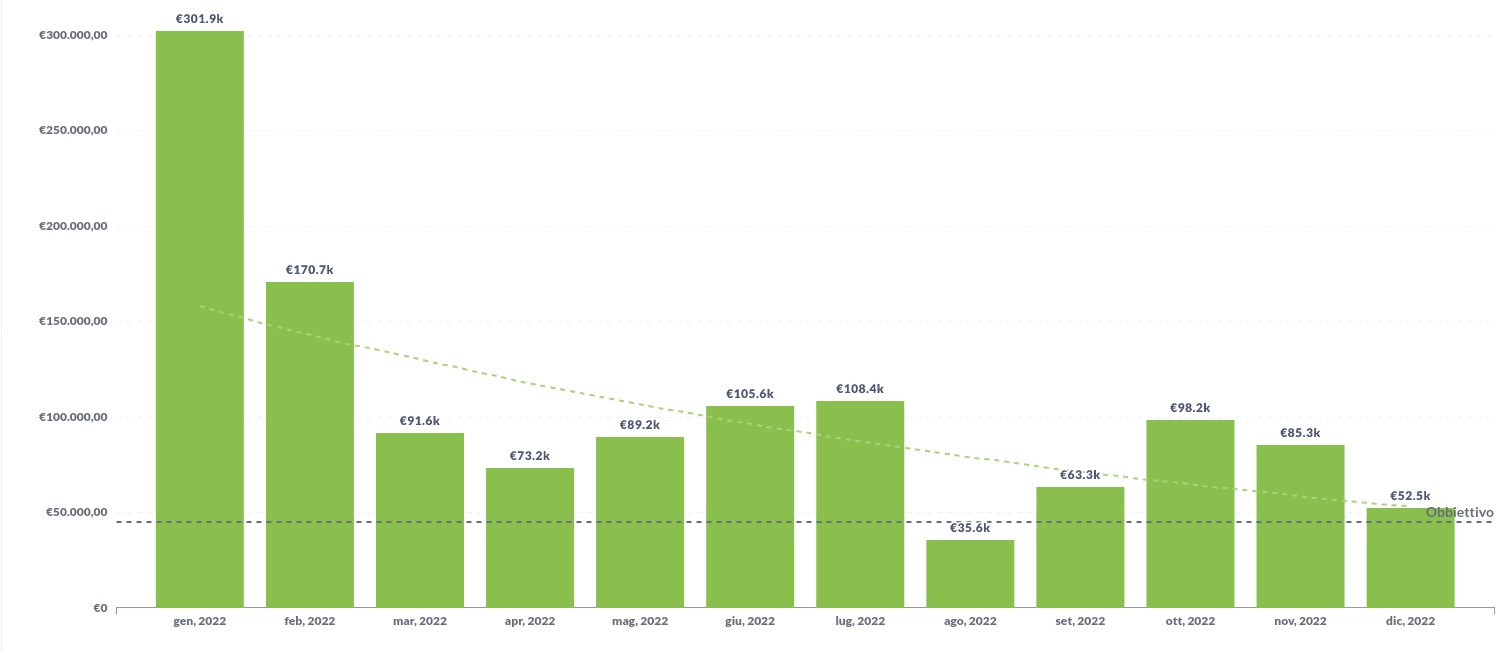
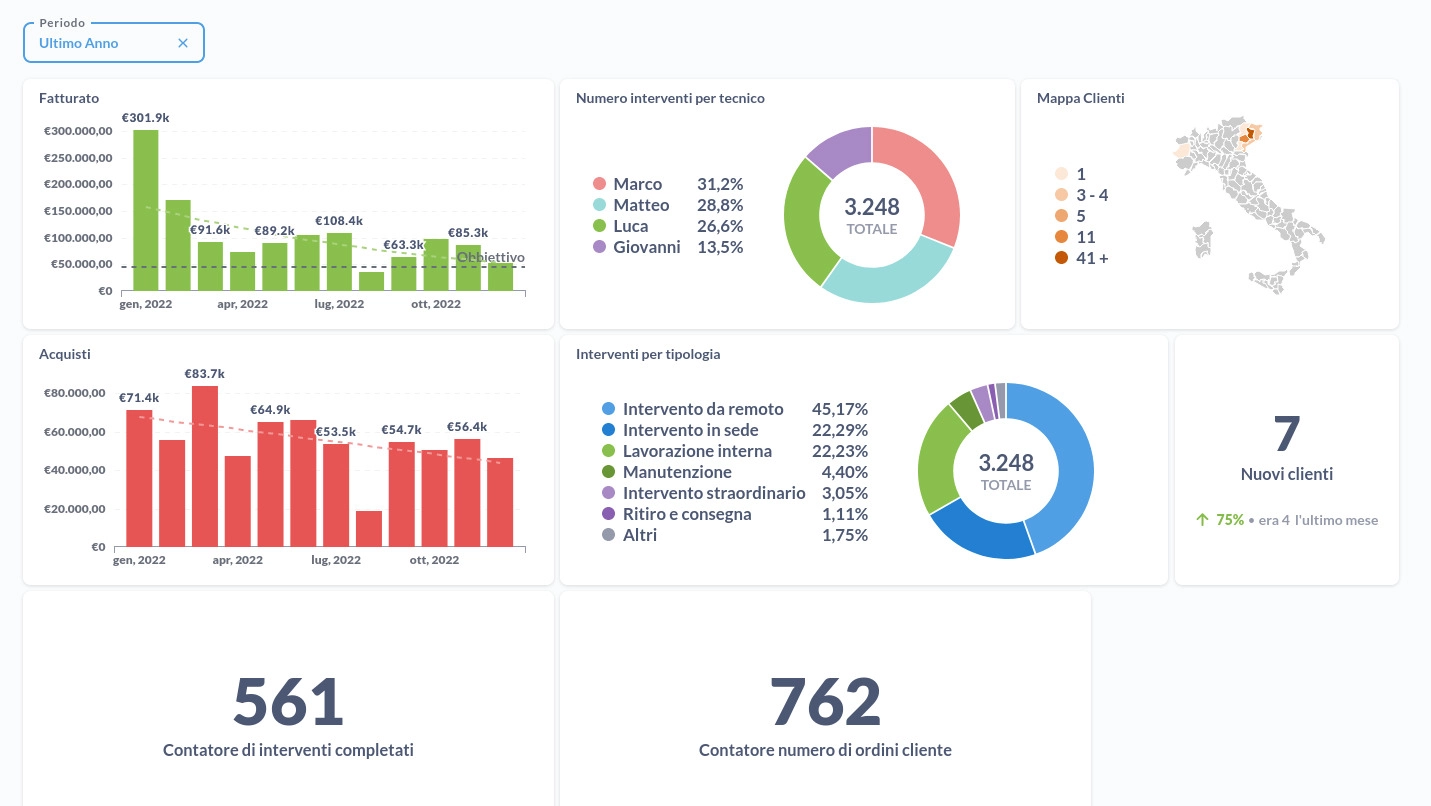
In this example, the annual revenue is displayed broken down by month with the corresponding trend line. It is also possible to set a monthly target to be achieved, represented by the horizontal line Target.
AREA GRAPH
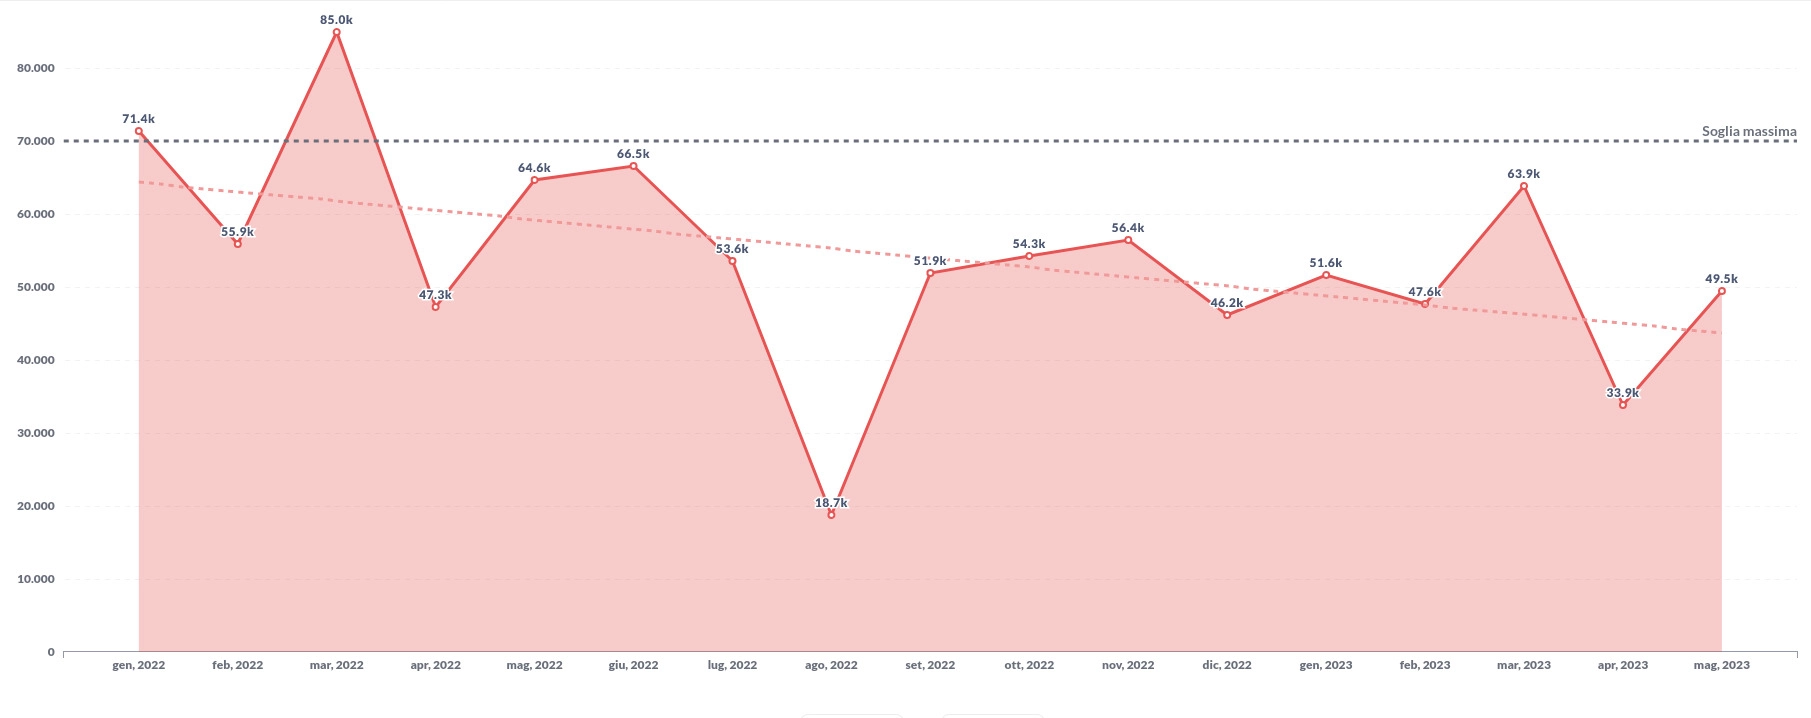
In this example, the expenses derived from purchase documents are displayed broken down by month with the corresponding trend line. A maximum threshold for expenses has been set, which was exceeded twice during the year. Starting from the Explorer package or higher, it is possible to set up the reception of an email whenever a threshold or set target is exceeded.
GEOGRAPHICAL MAP
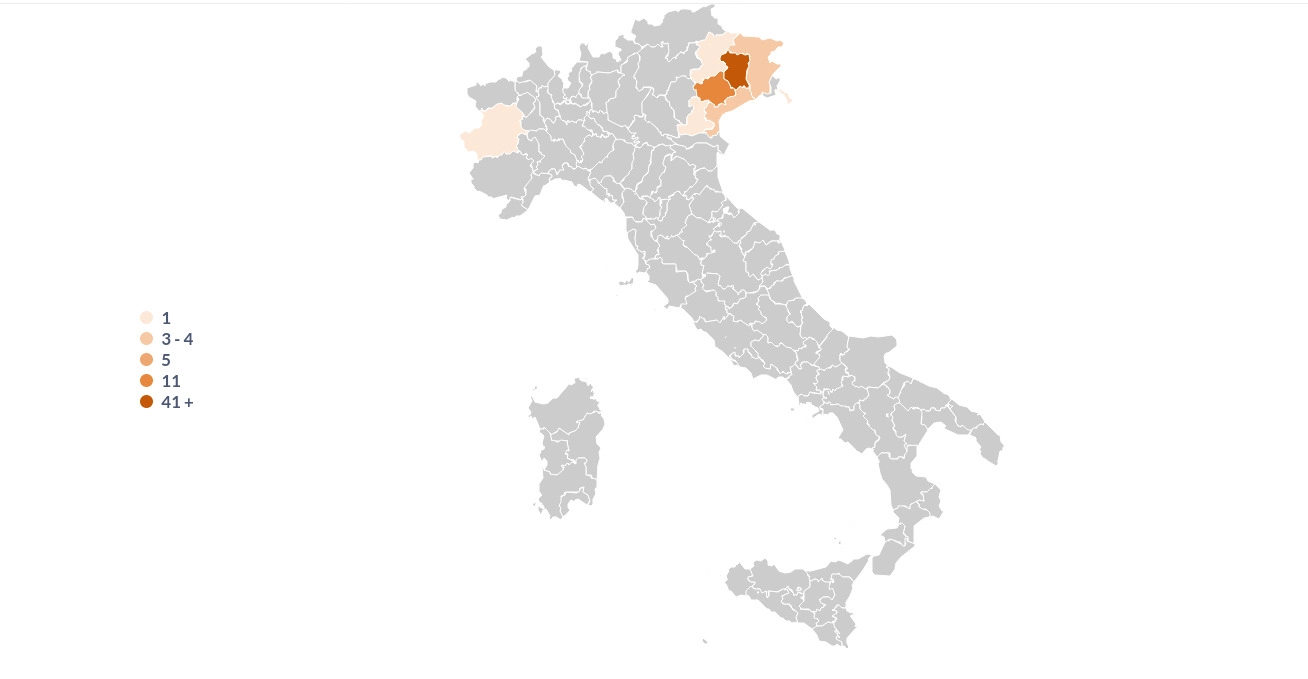
This example represents the distribution of customers on the map, based on the density of users broken down by province.
TREND ANALYSIS
This example analyzes the trend of new customers acquired compared to the previously analyzed period.
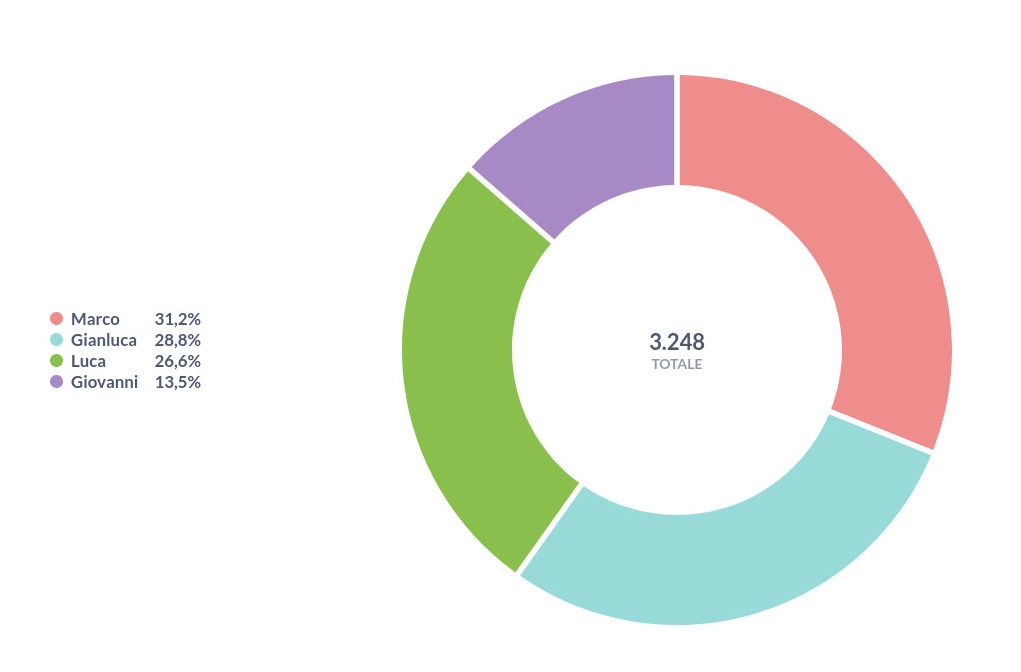
PIE CHART
This example allows you to analyze how many hours each technician has worked in proportion to all the interventions carried out.
COUNTER
In this counter example, the total count of interventions that are in "Completed" status is displayed.
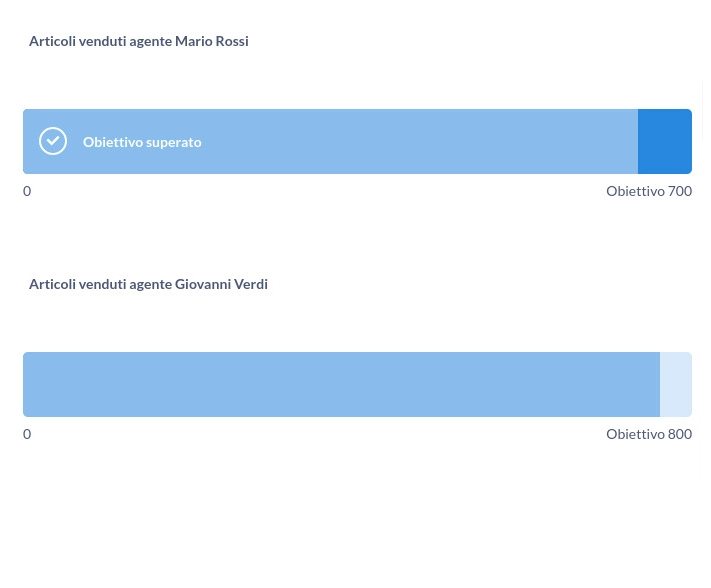
PROGRESS BAR
This example examines the sales of two agents, analyzing their progress against the set targets. Starting from the Explorer package or higher, it is possible to set up the reception of an email whenever a threshold or set target is exceeded.
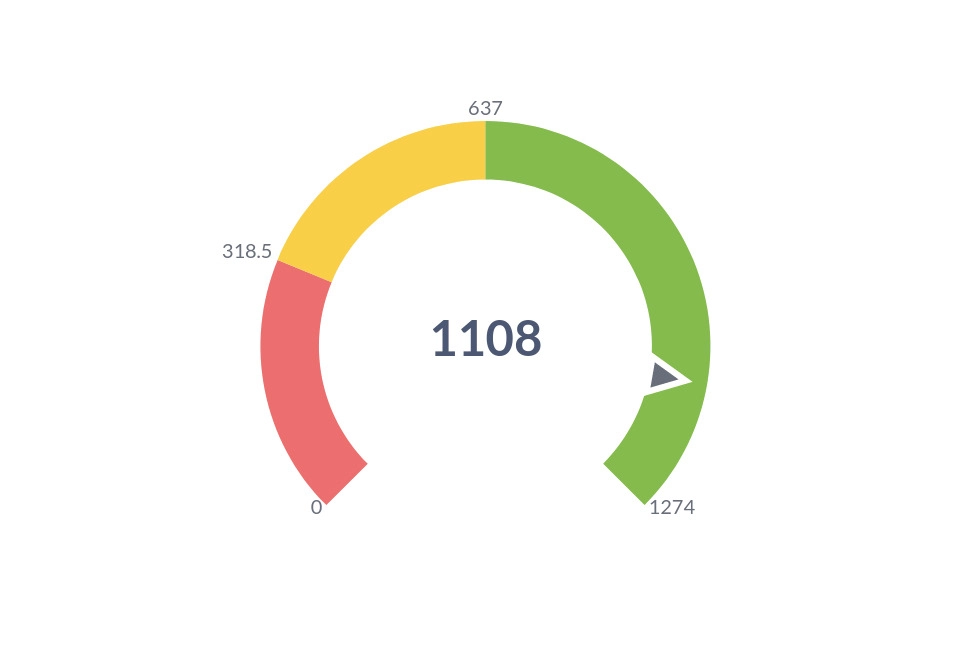
SPEEDOMETER
In this counter example, the number of invoices that are in Paid status is highlighted, in relation to the total number of sales invoices. It is possible to establish values below which the collected data is considered low, medium, or compliant.